
Field Test Romania (WP3)
General Framework for PMU data acquisition
Within Field Test Romania, UPB carries out monitoring activities of distribution grids in several installations operated by regional DSO and equipped by the energy division of EnergoBit. Here, the aim is to demonstrate the FISMEP platform’s ability to integrate information on energy distribution and voltage quality. The activities here include:
- Advancement of monitoring solutions for distribution grids
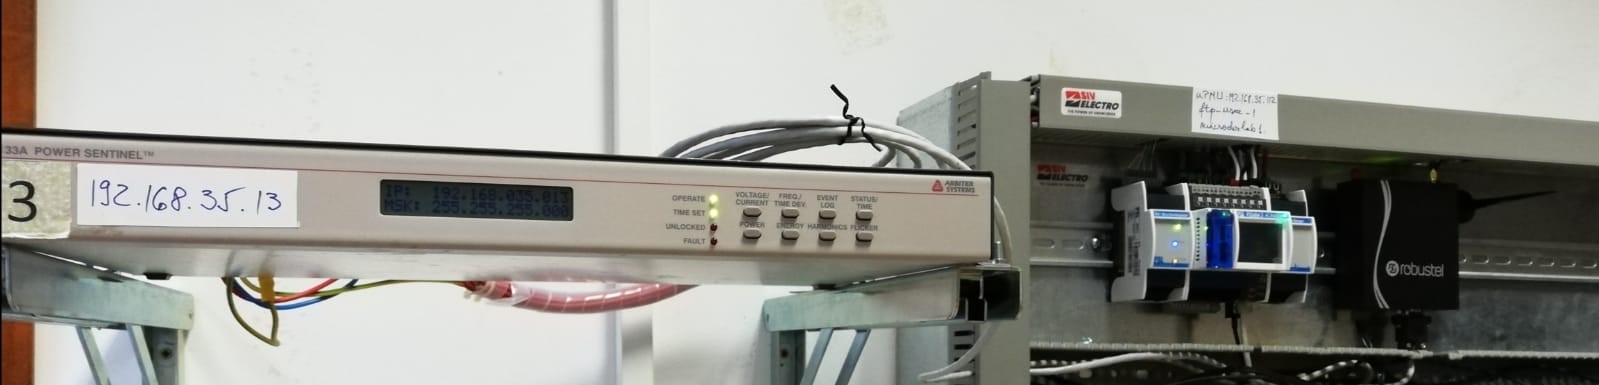
- Installation of mobile phasor measurement units (PMUs) as configurable monitoring nodes
- Tracking and evaluation of energy distribution and voltage quality
- Six months monitoring campaign with data fusion within FISMEP.
All the actions above will be conducted in the following nodes of the power system:
- LV grid node on UPB campus, Bucharest
- LV grid node with PV installation
- 20/0.4 kV substation (on LV side)
- Point of common coupling (PCC) of wind park, 20 kV and 110 kV.
First step into creation of the FIWARE based platform for PMU data integration and visualization was the definition of the data sequence to be sent to the platform and structure of the files to be extracted using the application, as follows:
- time stamp (UTC format);
- frequency [Hz];
- rate of change of frequency (ROCOF);
- voltage magnitude – RMS values [V];
- voltage angle [degrees];
- current magnitude – RMS values [A];
- current angle [degrees];
FIWARE-based solution for sending and receiving PMU data
Within Field Test Romania, after PMU installation, next step is to set-up the communication infrastructure that will facilitate the “road” from energy quantities acquisition to data integration using FIWARE based application, this means:
- Special routers installation together with each PMU in the field, responsible for sending data.
- Algorithm for communication protocol exchange, from C37.118 (standard for PMUs) to JSON format.
- Sending data using JSON to MongoDB and CrateDB databases.
- Testing the process of receiving data using an updated program.
The activities above could be generalized as “PMU data integration using MongoDB and CrateDB using JSON and MQTT, the entities having the general format established within WP3 of the project.
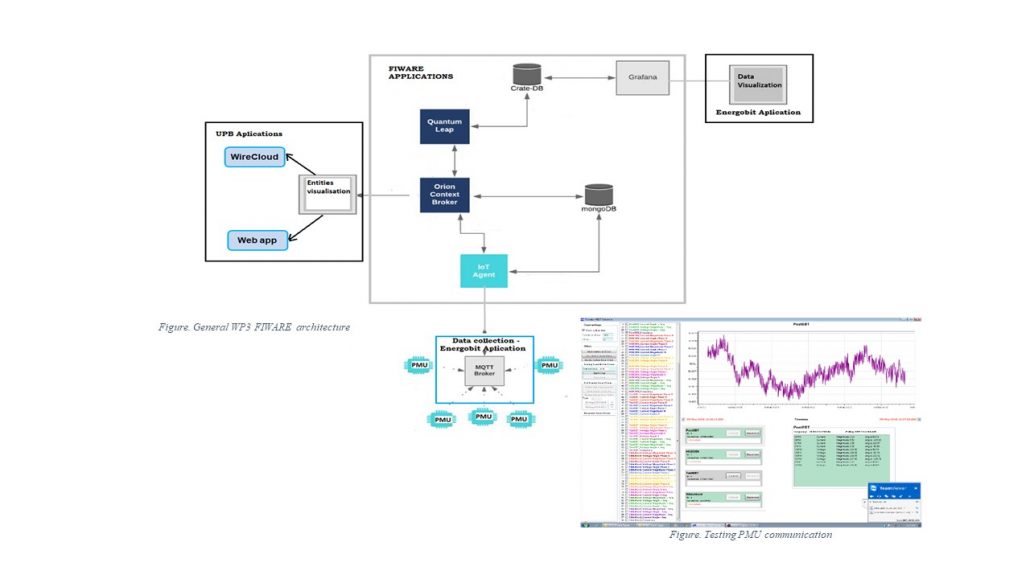
Fiware based solution for PMU data visualization
Beside integration of the data in the database, the UPB team works to develop the user interface for displaying the data from the PMUs (by querying the database where the data are stored). This application is based on WireCloud, a component developed under Fiware technology. Even though WireCloud is open-source, plug-and-play widget based and there are many applications already developed, the integration of PMU data has never been done. Thus, in order to create the application, the UPB team had to use the resources made available (already created by other users of Fiware technology and implicitly of the WireCloud application) but to modify them so that the widgets based on which WireCloud works , can query the database and then display the data from the PMU. Once the widget components are created and/or modified, the logic in which each of them interacts must be created.
The application interface (under development) will have the following features, also see the figure:
- Blue nodes – basic identifiable information
- Data selection – list with the variables
- Time window – date + time selection
- Multiple selection – same graph for multiple PMUs
- Band limit – addable p.u. threshold
- Download data – local download for restricted domains (based on IP